The Importance of Dashboards in Help Desk Software
Dashboards allow you to monitor, in real time, the key indicators defined by your company within the Help Desk software. From ticket status to SLA compliance, you’ll be able to clearly and centrally visualize your team’s performance and the quality of the service provided.

Enhance support management and experience with configurable dashboards
Rely on configurable dashboards that let you go beyond operational control. Clearly visualize critical information, identify areas for improvement, optimize your team’s resources, and deliver a more agile and proactive support experience.


Dashboard design
Advanced control panel for dashboards
Define which elements to display, how to organize them, and which key performance indicators (KPIs) to monitor. Design fully customized dashboards to stay in control of what truly matters.


Indicator-based segmentation
Analyze your support performance from different angles with flexible segmentation of key indicators.
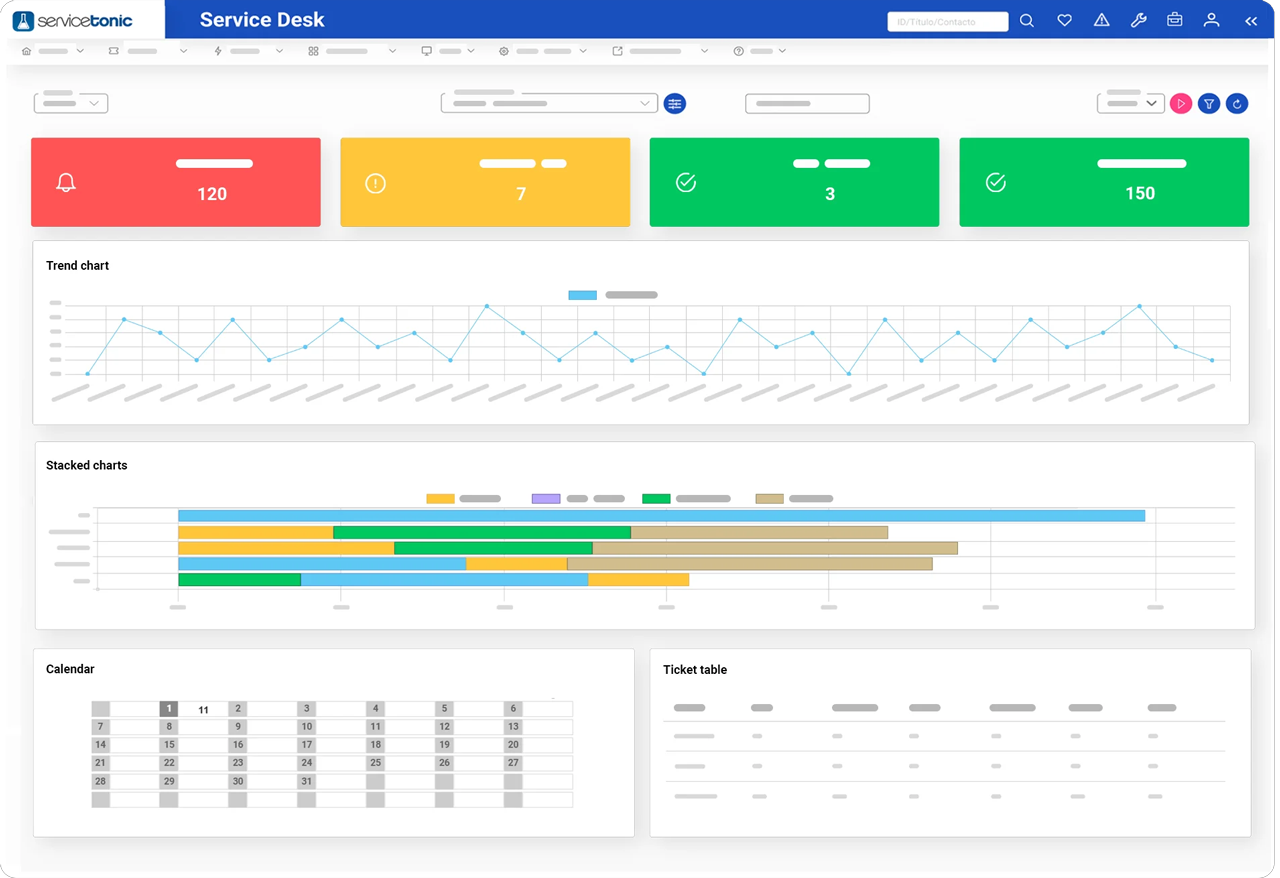
Trend charts
Track the evolution of your key indicators over time with dynamic line or bar charts.


Stacked charts
A clear and visual way to understand the total volume of tickets and their distribution based on the fields defined by each manager.
Calendar view
View your service tickets by date in a calendar-style chart.


Ticket table
View ticket lists in a table format segmented by different criteria:
Advanced control panel for dashboards
Define which elements to display, how to organize them, and which key performance indicators (KPIs) you want to monitor. Design fully customized dashboards to stay in control of what truly matters.
Segmentation based on indicators
Analyze the performance of your support from different perspectives through flexible segmentation of key indicators.
Trend charts
Visualize the evolution of your key indicators over time through dynamic line or bar charts.
Stacked charts
A clear and visual way to understand the total ticket volume and its distribution based on the fields defined by each manager.
Calendar view
View your service tickets by date in a calendar-style chart.
Ticket table
View ticket lists in a table format segmented by various criteria:
Types of dashboards
With ServiceTonic’s Help Desk software, you can create as many dashboards as you need, fully adapted to your operations and with no programming required.