
These metrics help you understand how requests are handled, their resolution time, and which areas you can optimize—either resources or processes—turning them into a key foundation to drive productivity and service quality.
Introduction to Help Desk metrics
Why measure Help Desk performance?
Evaluating Help Desk performance metrics is essential to make sure customer service is delivered with quality, speed, and effectiveness.
By analyzing indicators like response times, support ticket resolution, or user satisfaction, organizations can spot bottlenecks, improve processes, and optimize the customer support experience.
Measuring performance doesn’t just help improve internal efficiency—it also lets you anticipate problems, minimize recurring incidents, and make sure the team works aligned with business goals.
Difference between operational metrics and productivity metrics
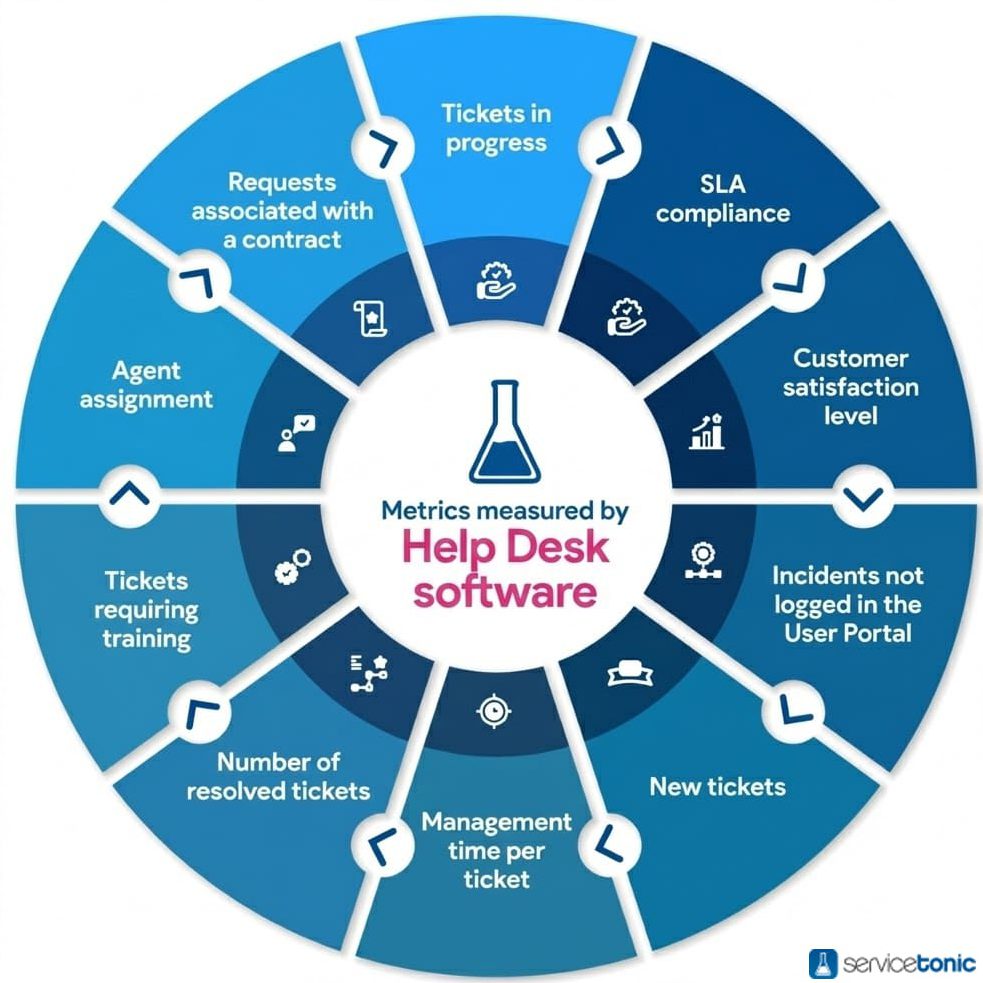
The 10 most common metrics in a Help Desk can be grouped into two categories: operational metrics and productivity metrics.
- Operational metrics measure daily service activity—like the volume of tickets logged in your Help Desk software, intake channels, or SLA compliance. They’re essential for understanding what’s happening in real time and how customer service demand behaves.
- Productivity metrics, on the other hand, analyze team performance: how many tickets each agent resolves, the average time spent per action on the ticket, or how efficiently requests are handled. These metrics let you evaluate the support team’s performance and spot improvement opportunities at both individual and team level.
Beyond these two categories, it’s important to keep in mind that performance metrics exist as a broader concept that includes every indicator used to evaluate how the Help Desk works. Within these performance metrics fall both operational and productivity metrics.
So every metric that analyzes team efficiency, service quality, or ticket management is part of the Help Desk’s overall performance—even though only some of them are directly tied to support team productivity.
How to choose the Help Desk metrics that matter for your organization
Picking the right Help Desk metrics depends on each organization’s goals and the type of customer service you want to deliver. The recommendation is to start with operational metrics that give you direct information on efficiency and quality—like first response time, resolution time, user satisfaction, or the percentage of reopened tickets.
From there, you can layer in more specific productivity metrics to identify optimization areas inside the support team, plus metrics focused on ticket volume and behavior.
The key is picking metrics that are useful, easy to read, and that genuinely help improve customer service—instead of stacking up data that serves no purpose and only complicates daily work.
Operational Help Desk metrics
With ServiceTonic’s Help Desk software, the operational metrics you can evaluate are:
1. SLA compliance
With ServiceTonic you can measure SLA resolution time and response time. SLAs (Service Level Agreement) are contracts that describe the service level a customer expects from their provider.
Having Help Desk software that can define service level agreements (SLAs) lets your company commit to its customers, which in turn guarantees support service renewal and contributes to better problem resolution.
That’s why ServiceTonic lets you define both the response time and the resolution time of your SLAs, then apply them to support tickets created by users or customers.


Thanks to this field on tickets, you can measure which tickets meet the established SLAs and which are about to hit their time limit—letting agents prioritize them.
You can also generate reports using these results. These reports let you measure both resolution times and response times in your Help Desk software. Through them, you get valuable insights that support decision-making to improve the services you offer.
2. Customer satisfaction level
Unlike SLA response and resolution times, which are real, tangible values, customer satisfaction with help desk software is a more abstract metric. There’s no gauge that tells you how satisfied customers or users are—the best way to measure it is by asking them directly.
That’s why ServiceTonic offers different types of satisfaction surveys: custom surveys or template-based ones, plus star-rating surveys that let users rate the services.

3. Tickets created outside the User Portal
If your help desk software has a User Portal, it’s easy to centralize the management of every support ticket—from both users and customers—and pull metrics directly from the platform itself.
However, not every user has access to the Portal at all times, so it’s essential to have a multichannel Help Desk that lets you generate tickets from email, phone, web chat, or other available channels.
Being able to measure the total number of tickets created through these channels outside the User Portal gives your company a complete view of the incident and request flow. This makes it easier to roll out actions that streamline management and improve support efficiency.
Thanks to ServiceTonic’s custom views, you can identify how many support tickets or requests have been logged on each channel and generate reports in formats like Excel, PDF, or HTML. This information lets you analyze behavior, optimize resources, and improve the quality of service.

4. New tickets
One of the most important metrics in any Help Desk software is knowing the number of incoming tickets or support requests.
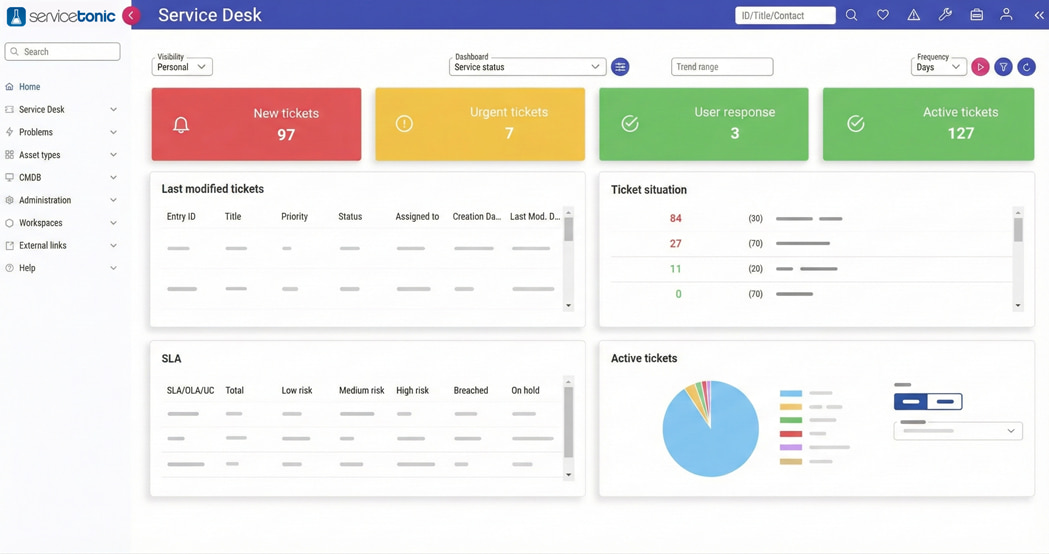
With ServiceTonic, you can measure new ticket volume either through user-configured reports and queries or from the customizable dashboard—which lets every agent see new daily tickets, tickets in a specific status, tickets assigned to a particular agent, and many other custom configurations.
Tracking this metric helps you spot ticket backlogs, demand spikes, or workload increases that could affect service.
Thanks to this information, your company can accurately evaluate how many agents you need to efficiently handle that ticket volume and guarantee fast, high-quality support.
5. Requests linked to a contract
Help desk software also needs to measure the hours billed to a project. ServiceTonic lets you manage hours linked to a contract and pull reports—both for users and for agents themselves—so you know how many hours are left on a contract or whether it’s time to renew.
6. Tickets in progress
Knowing the status of every request or support ticket helps you spot which ones are falling behind—whether they’re waiting for a customer’s reply, an additional confirmation has been requested, information is missing to move forward, or support agents haven’t been able to give them the priority they need.
This kind of tracking also lets you spot delays that can affect the average response time—a key indicator of service quality.
Measuring tickets in different statuses inside your Help Desk software makes it easier to plan future work, balance the load between agents, and coordinate tasks better with customers.
This contributes to more efficient management and a better overall support experience.
Support team productivity metrics
7. Resolution time
Time to handle each ticket, or resolution time—how long it takes an agent to resolve a request—is a fundamental metric inside any Help Desk software.
This indicator lets you evaluate not just the speed of support, but also how efficient the support delivered to the user actually is.
Resolution time is calculated from the moment a support request is created until it’s definitively closed. To control response time better, ServiceTonic lets you log the time spent on every action taken within the ticket. Once the request is closed, the system automatically adds up every action’s duration—so you know exactly how long it took to resolve each ticket.
By combining this value with the ID of the agent who handled the incident, you can analyze the time invested by each team member and pull key insights to improve support efficiency and service productivity.

8. Number of resolved tickets
The next metric that delivers value is knowing the number of tickets resolved in a day, a week, or a month—and it’s essential that this metric can be compared to ticket creation in a day, a week, and a month, so you can measure how many tickets agents are actually capable of resolving.
For performance to be effective, the number of open requests can’t exceed the number of resolved ones.
Thanks to custom views, ServiceTonic lets you measure open tickets vs. resolved tickets. Once the view is set up, all that’s left is to generate the report and make the right decisions.
9. Tickets that require training
Users or customers often open requests that could be easily resolved through training or by checking a well-structured knowledge base. In many cases, certain concepts haven’t fully landed and they generate tickets that aren’t real incidents—just questions that could be solved with better learning.
To spot these situations, you can create a custom field in your Help Desk software that flags whether a ticket requires training. At the end of a specific period, you can measure these results and analyze whether there’s a significant volume of requests that could have been avoided with extra training or a more complete knowledge base.
If you spot the trend, the team can propose training sessions for the customer.
The goal is twofold: improve the user experience—they feel more confident and autonomous with the tool thanks to this new knowledge—and optimize agents’ time, so they can focus on tickets that deliver more value or genuinely require technical intervention.
10. Agent assignment
An indispensable metric to track in Help Desk software is the number of tickets assigned to each agent.
Knowing how support requests are distributed lets you improve the immediate response time delivered to the customer—since that new ticket can go to the agent or agents with the lowest workload.
With ServiceTonic, measuring and identifying the agents with the most bandwidth is easy: thanks to dashboard customization, you can build a panel that shows the tickets assigned to each agent.
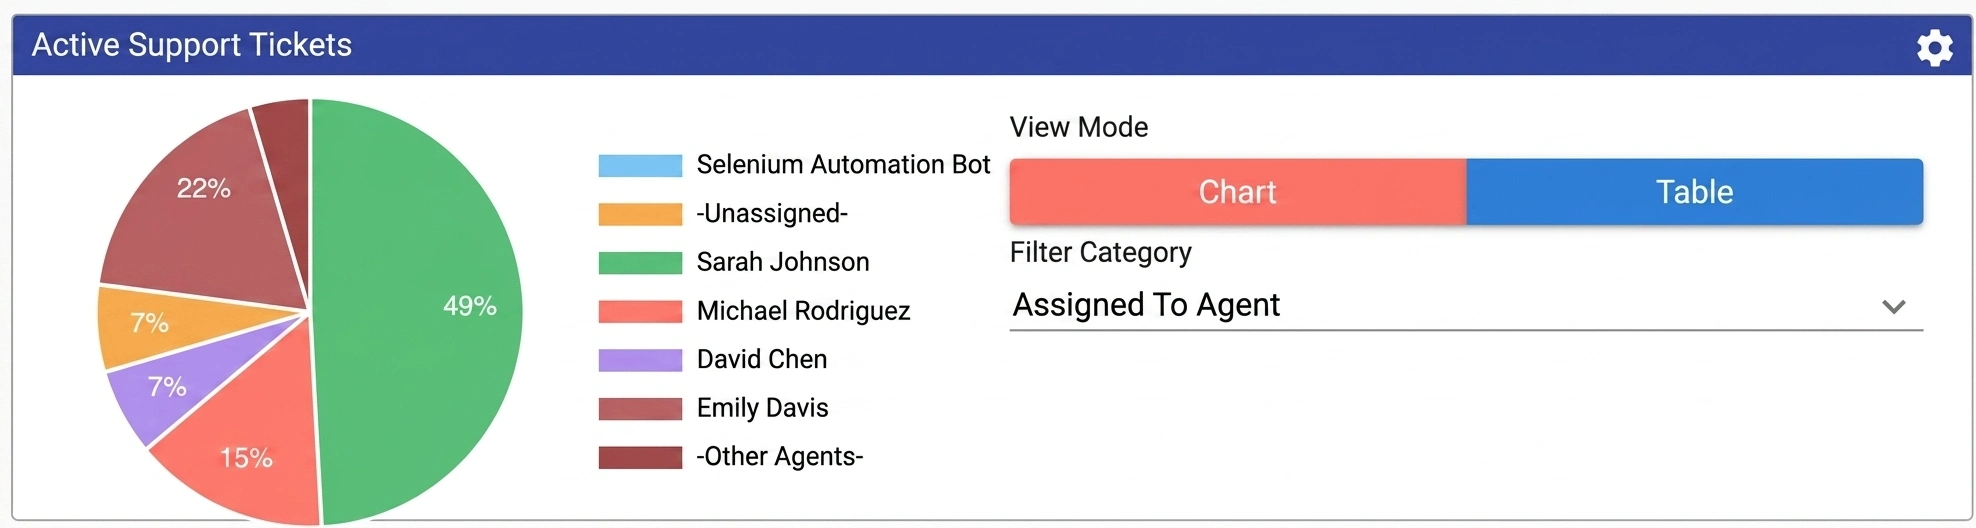
If you want a more detailed view of the tickets one of those agents is handling, just click on them and ServiceTonic opens a custom view with the requests assigned to that specific agent.
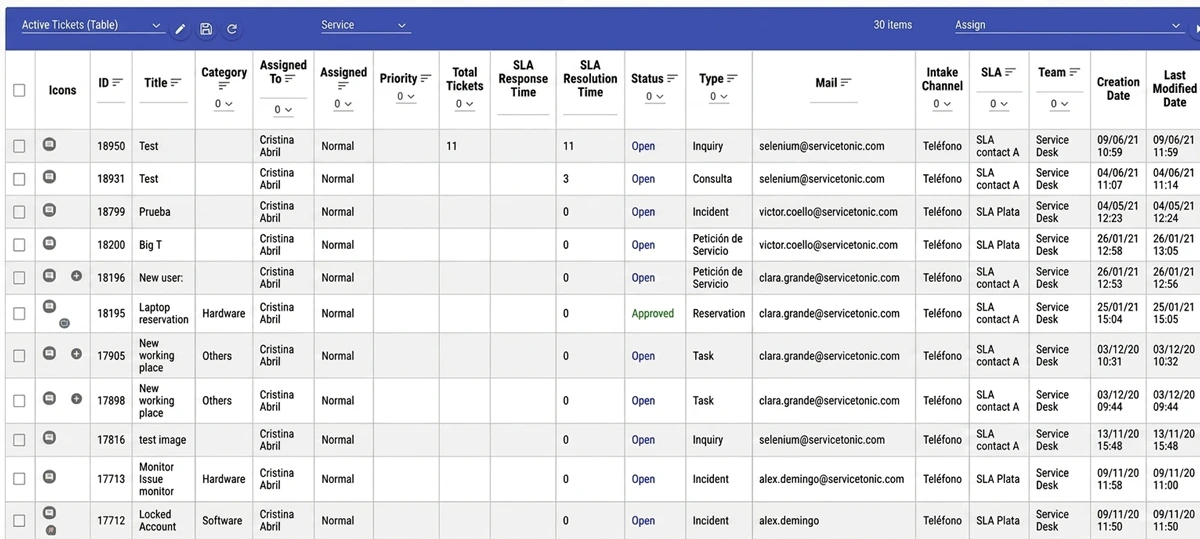
This also lets you measure agent performance through your help desk software: you can find out which agent has resolved more or fewer requests, how much time was spent on them, whether they met the established SLAs, and how many of those requests received the best ratings.
Finally, from these views, you generate the reports to draw conclusions in Excel or PDF from all these values.
Frequently asked questions
What are Help Desk metrics?
Help Desk metrics are indicators that let you evaluate how a support service is working—measuring both team efficiency and the quality of service delivered to users.
These metrics measured in Help Desk software include data like response times, ticket volume, SLA compliance, or agent productivity, and they help improve management and the customer experience.
Which are good metrics for a technical support service?
Good metrics for a technical support service are those that let you evaluate both service quality and team efficiency.
The most useful ones include:
- SLA compliance
- Customer satisfaction level
- Number of created tickets
- New tickets
Conclusions on measuring Help Desk software metrics
With these 10 metrics that you can measure in Help Desk software, you can pull reports and statistics that help improve the service you deliver to your customers.
The goal of drawing conclusions from these metrics is to improve customer service—the cornerstone of any company’s survival, especially today, when the Everything As a Service model has taken over.
ServiceTonic measures all these metrics
As you’ve seen with each of these metrics, ServiceTonic—as Help Desk software—lets you measure these values. But there are many more, and thanks to the tool’s deep customization, it can cover any other metric not described in this article that’s essential for your company.
- Tickets linked to a contract
- Tickets in progress
- Time spent per ticket
- Number of resolved tickets
- Tickets that require training
- Agent assignment
What are performance metrics?
Performance metrics are indicators that let you evaluate how a service, process, or team is working in terms of efficiency, quality, and effectiveness. In a Help Desk, these metrics show whether support is responding on time, resolving requests properly, and delivering a good user experience.
Why are KPIs and metrics important for Help Desk and Service Desk?
KPIs and metrics for Help Desk and Service Desk matter because they let you evaluate support quality, spot problems, improve team efficiency, and make data-driven decisions.
Thanks to these indicators, you can optimize response times, balance workloads, and deliver a better user experience—driving continuous service improvement.
How do you measure Help Desk success?
Help Desk success is measured through metrics like response and resolution times, customer satisfaction, SLA compliance, and team productivity. These indicators let you evaluate the quality of support operations and check whether the service delivers efficient, user-oriented care.
Does Help Desk software improve management and response time?
Yes. Help Desk software improves management and reduces response time because it centralizes requests, automates tasks, and organizes workflows. That lets you handle tickets faster, more efficiently, and with better coordination between agents.