Table of Contents
Case study of how to balance work among your agents
When managing teams, we see the need to distribute and revise their workload: Are the assignments of our agents realistic, or is there any oversaturation? Are all customers getting a timely response, or are there unresolved or unattended tickets about to breach Service Level Agreements?
Let us look at how ServiceTonic’s Dashboards can help us distribute the workload in a realistic and balanced way among our agents.
Balancing by agent’s workload via Dashboards
Visualize
If you add a chart to your Dashboard and select the attribute “Assigned”, you will see all the tickets segmented by each agent’s workload as follows:
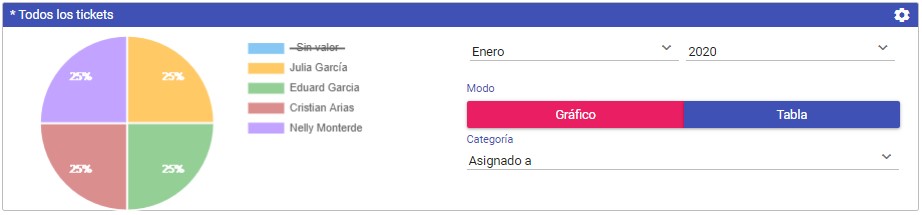
This graphic retrieves the information of a service’s active tickets, for example, it is possible to only visualize the tickets of 2nd Level.
Act
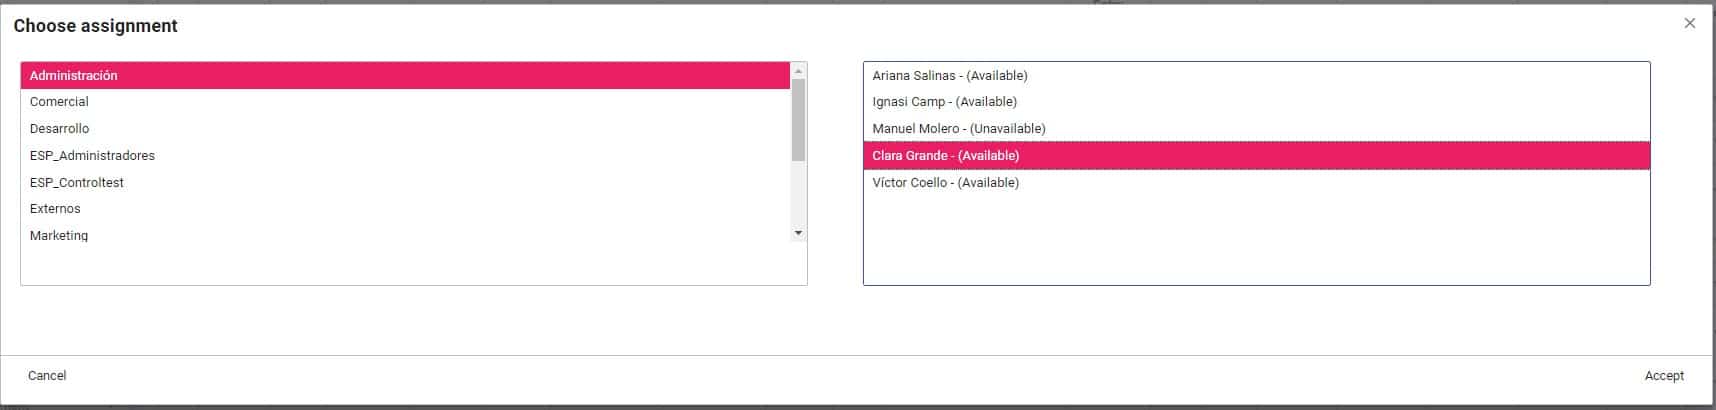
If you detect that an agent has too many tickets assigned to them, click on their section of the graph to go to a list of all the active tickets assigned to them – being able to view the status of each ticket, its priority, expected delivery dates, etc.
Now the team leader or service desk manager can use informed decision to reassign tickets to another agent with just one click.
Balancing by priority
Visualize
If you add a stacked chart to your Dashboard, you can cross-reference the priority of the active tickets with the agents that they are assigned to:
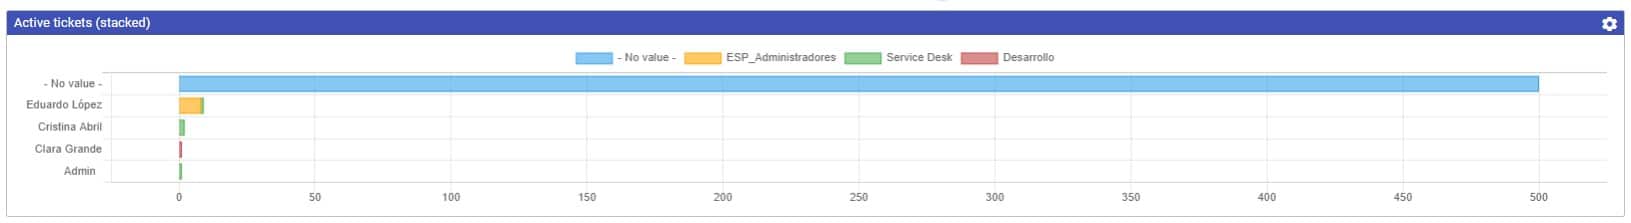
This chart allows us to predict if the tickets with the highest priority can be solved within the time set by our quality parameters.
Here we see how the one agent, even though they have fewer tickets assigned than others, has the highest workload. This is because, for most of the tickets assigned to them, they will have to respond and resolve with the greatest urgency
Act
If you detect that an agent has a greater load of critical tickets than desired, you can also access to the segmented list of tickets from the chart, and proceed to reassign to another agent.
Now, the workload by priority is balanced:
View your own chart
With ServiceTonic you can define any type of graphic in order to get the complete picture or have a very specific view of the tickets around your service.
In addition, easily and without coding, you can configure:
- The indicators you want to view.
- The display format (charts, lists, calendars…).
- The time interval for self-refresh of the different charts.
- The layout of the Dashboard page with several views of the service
All of this comes with the ability to create more than one Dashboards, which you can easily switch through.
To start defining better Dashboards access the Administration of your ServiceTonic or let our ServiceTonic Support Team guide you through it.