What is new in ServiceTonic’s Dashboard
The dashboard or control panel is a type of dynamic screen where the relevant indicators or KPIs for the service or business are shown, previously defined by the person in charge.
ServiceTonic dashboards are 100% configurable by the user without the need for programming knowledge.
Following ServiceTonic’s philosophy, this dashboard has always evolved to meet our users’ requirements.
The new features introduced are detailed below.
- SQL queries (SQL subtype)
- % indicator element
- Date range for trend elements
- Filters
Changes in List and Total elements
Two new subtypes have been added to the List and Totals type elements: SQL queries and the result in percentage.
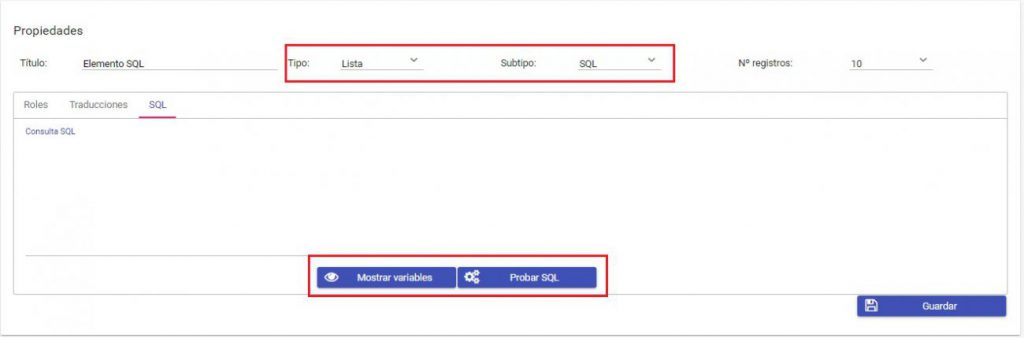
SQL subtype
The «SQL» subtype has been added to the list and total elements types, allowing panels that include this type of elements to show values that are the result of a SQL query.
Create the SQL queries
To create, from the dashboard elements, the SQL queries, ServiceTonic offers a wizard that is displayed when the element type is List or Totals.
This same wizard shows the list of variables that can be part of the query, as well as a validator of that query.
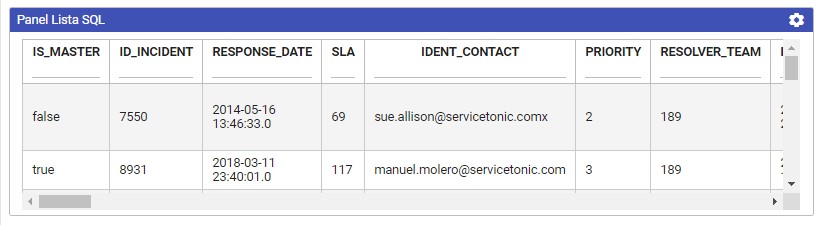
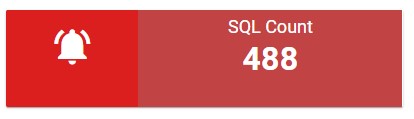
Panel query with SQL results
The results of these SQL queries will be displayed in List or Totals panels but, unlike the other panels, they are not selectable. They are only informative panels:
SQL List panel type
SQL Total panel type
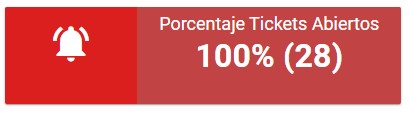
Percentage sub-type (%)
It is possible to display panels of type percentage in which you see a percentage set in the criteria defined during the creation of the element. It is now possible to display that percentage together with the absolute value corresponding to that percentage.
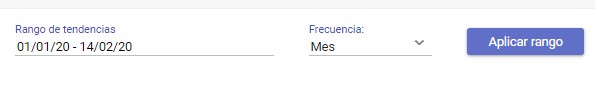
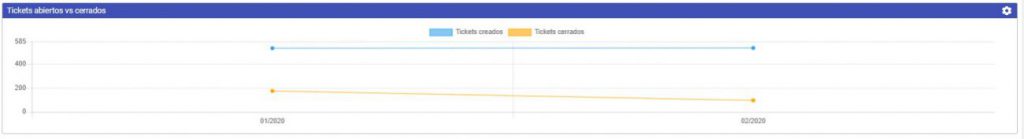
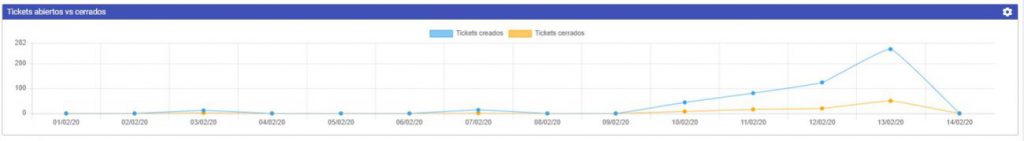
Trend Range
In the trend type panels it is possible to specify a date period for a query. This period of time can be expressed in days, months or years.
The range cannot exceed 36 units: that is, if you want to know the trend range of a two-month panel, in the “Frequency” field you will specify “Month” or “Year”.
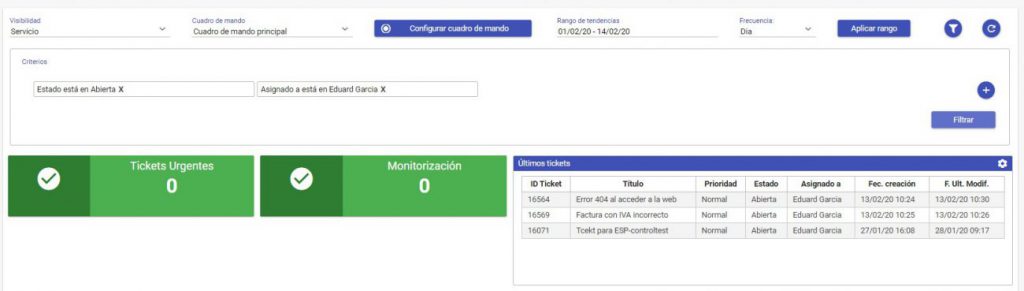
Filters in the dashboard
Filters have been created in which the user can apply some criteria whose results will be shown in the different panels of the dashboard.
It is possible to apply more than one criteria and the logic followed is that of «AND», that is, the results that meet all the indicated criteria will be shown in the panels, for example: show all the tickets that are in “open” status and ythat are assigned to a specific agent.